The SimpleDash dashboard, card by card
What every number, chart and list on the SimpleDash dashboard means, which Google Analytics 4 metric is behind it, and where to find it in GA4.
The dashboard is one page: four numbers and a chart at the top, then what changed and where, then lists of where visitors came from, what they read and where they are. Every number comes from your Google Analytics 4 property, in plain words, with the same number one click away in GA4 if you want to check.
The four numbers
Each number is compared with the period before (for example the 7 days before), with an arrow and a word, never only a colour.
| Number | What it means | The GA4 metric |
|---|---|---|
| Visitors | People Google Analytics counted. People who refuse cookies or block GA aren't included. | Active users |
| Page views | How many times your pages were viewed. One visitor can view many pages. | Views |
| Avg. time | How long a visitor spends with your site open and in view, on average. | User engagement duration ÷ active users |
| Signups | How many times the action you chose as a signup happened. | Event count of that event |
Signups stays empty, never a fake zero, until you choose an action. See Choose what counts as a signup.
Visitors over time
A chart of visitors per day (per hour for Today and Yesterday, per month for 12 months). The last part is dashed while it's still filling up: today, or a day Google is still adding to. Hover or tab to a point to see its number, or choose View as table.
Chart notes
Add a note to a day ("Launched on Product Hunt") with + Add note, or by picking a point on the chart. Notes are short (80 characters), show as small markers, and are only yours: they never appear on public pages and are never sent to Google.
What changed
Right under the chart: which sources moved your visitors against the period before, and the landing pages behind each move. With Pro, it does the same for signups and sales, and adds the Google searches. What changed.
Sources and Channels
Where visitors came from. Sources shows the site or app (Google, X, a newsletter, chatgpt.com). Channels groups them:
| In SimpleDash | GA4's channel |
|---|---|
| Direct | Direct |
| Search | Organic Search |
| Social | Organic Social |
| Other sites | Referral |
| AI assistants | AI Assistant |
| Video | Organic Video |
| Search ads, Social ads, Display ads, Other ads | Paid channels |
| Unknown | Unassigned |
Direct means GA4 couldn't tell where the visit came from: a typed address, a bookmark, or a link in an app that hides it. Why direct traffic is high.
If a payment page such as Stripe Checkout shows up as a source, the card warns you: GA4 is giving your sales to the payment page. How to fix it.
AI traffic
Visitors who came from AI assistants such as ChatGPT, Perplexity, Claude, Gemini and Copilot, split by assistant, and the pages they landed on. Google's AI Overviews count as Google search, because Google reports them that way. How AI traffic is counted.
Pages and Landing pages
Top pages shows the pages viewed most, with views and visitors. Landing pages shows where visits started: the page someone saw first.
Countries
Country and City, by visitors. Places come from the visitor's network, so a city can be a nearby one. Cities Google couldn't place are grouped as "Unknown".
Devices
Browser, OS and Device (desktop, mobile, tablet), as Google Analytics names them. In-app browsers, like Instagram's, are listed on their own.
Actions
Downloads, outbound clicks, form submits and your signups, as GA4 recorded them. GA4 counts the first three only when Enhanced measurement is on in its data stream settings, so the card says so if they're all empty.
Right now
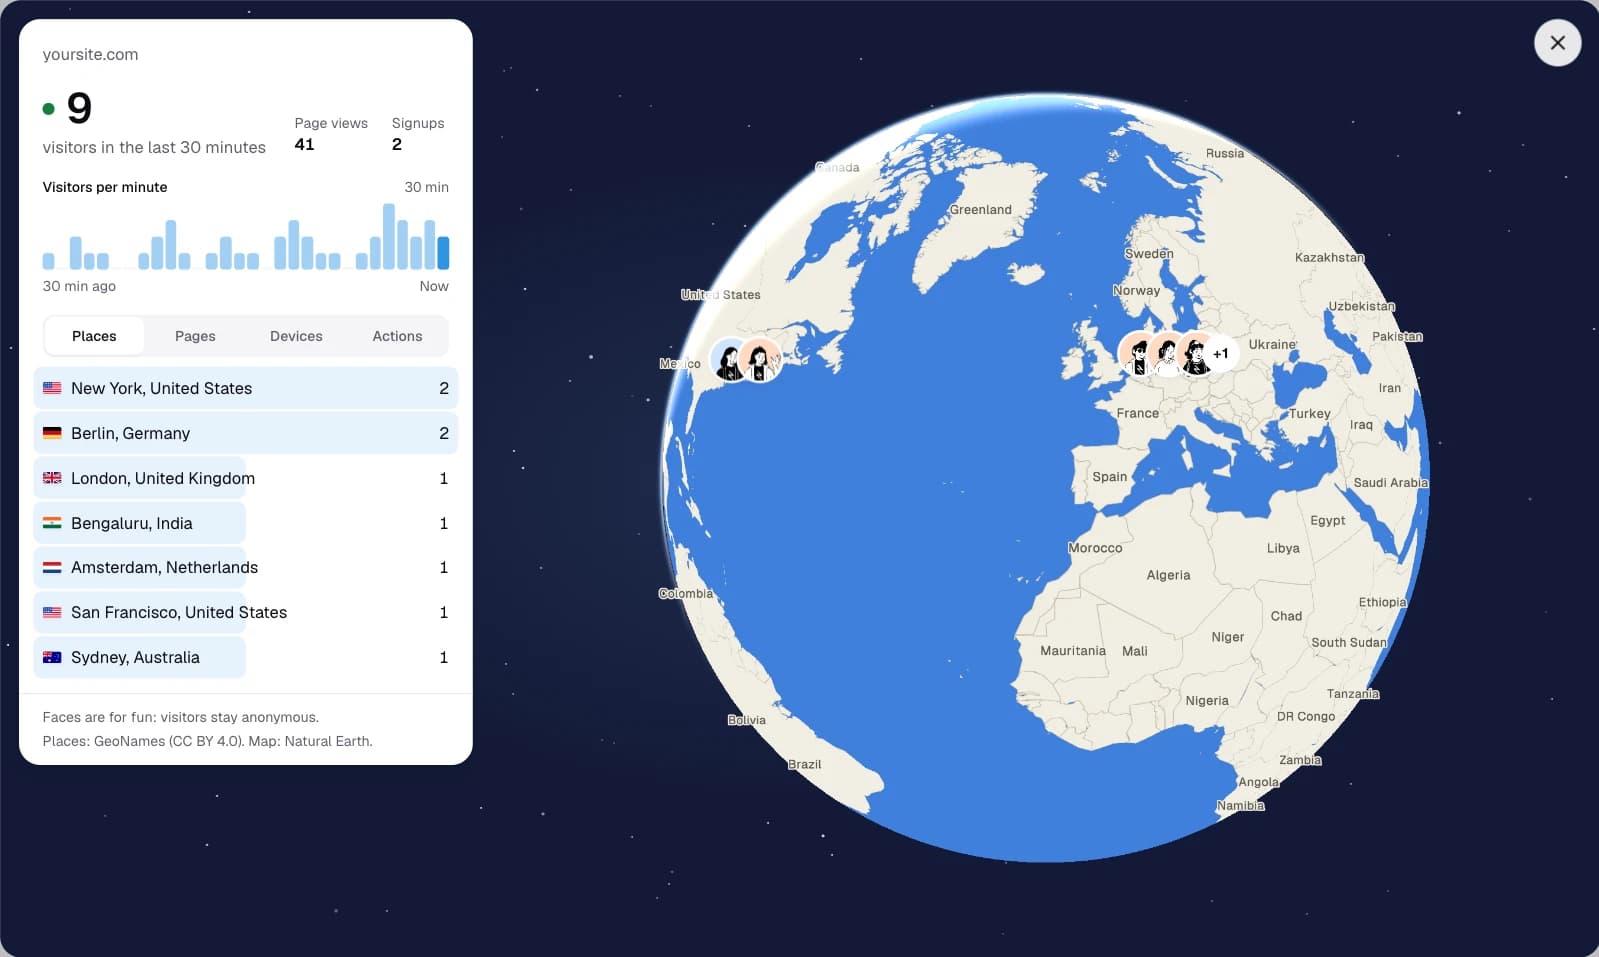
Right now, the last number of the overview, is how many people were on your site in the last 30 minutes. The dot turns green and pulses while anyone is there. It updates every 20 seconds while the tab is open, and once more 5 seconds after you open the dashboard: if you've just opened your own site, you'll see yourself.
Click it (Open the globe) for the live view: a globe with a drawn face for each visitor at their city, and a panel with the count, page views, signups, visitors per minute, and four tabs:
- Places: cities, busiest first. Pick one and the globe flies there.
- Pages: the pages people are on. Google's realtime data has page titles rather than page addresses, so the list shows titles.
- Devices: desktop, mobile and tablet.
- Actions: downloads, outbound clicks, form submits and signups, as on the Actions card.
The faces are only decoration: Google tells SimpleDash how many people are in a city, never who they are. Google's realtime data doesn't say where visitors came from, so there's no sources list here. The map is part of SimpleDash: nothing is loaded from a map service.
More, and CSV
Each list shows its top 10. More opens the whole list with a search box and a CSV download. The overview's download menu exports the chart and the four numbers.
Pro cards
With Pro, the dashboard also shows:
- Revenue and New customers from your Stripe account, with revenue bars under the visitors chart. Revenue from Stripe.
- What brings customers: where the people behind your signups and sales first found you, next to the visit it happened on, and how long it took. What brings customers.
- Google search: one page to work on this week, the pages that bring signups with their searches, searches close to page 1, what changed and more. Google search insights.
Related
Last updated
Your sites
The site menu lists every Google Analytics site your Google account can see. Open any of them with one click, on Free and Pro, with no limit on sites.
What changed
The card under your four numbers shows which sources moved them against the period before, the landing pages behind each move, and Google searches.